myXCLASSMapFit
Fitting an ALMA data cube using the myXCLASSMapFit function. A full description of the myXCLASSMapFit function with all in- and output parameters can be found in Sect. “myXCLASSMapFit”.
The purpose of this tutorial is to describe how to analyze an ALMA data cube using the myXCLASSMapFit function.
All files used within this tutorial can be downloaded here.
Getting the Data
The data used in this tutorial is part of the Science Verification Data. The complete ALMA Band 6 data set from IRAS 16293 (45 MB) can be downloaded here:
wget https://almascience.eso.org/almadata/sciver/IRAS16293Band6/IRAS16293_Band6_ReferenceImages.tgz
The data file is already contained in the zip file of this tutorial.
ds9 region file
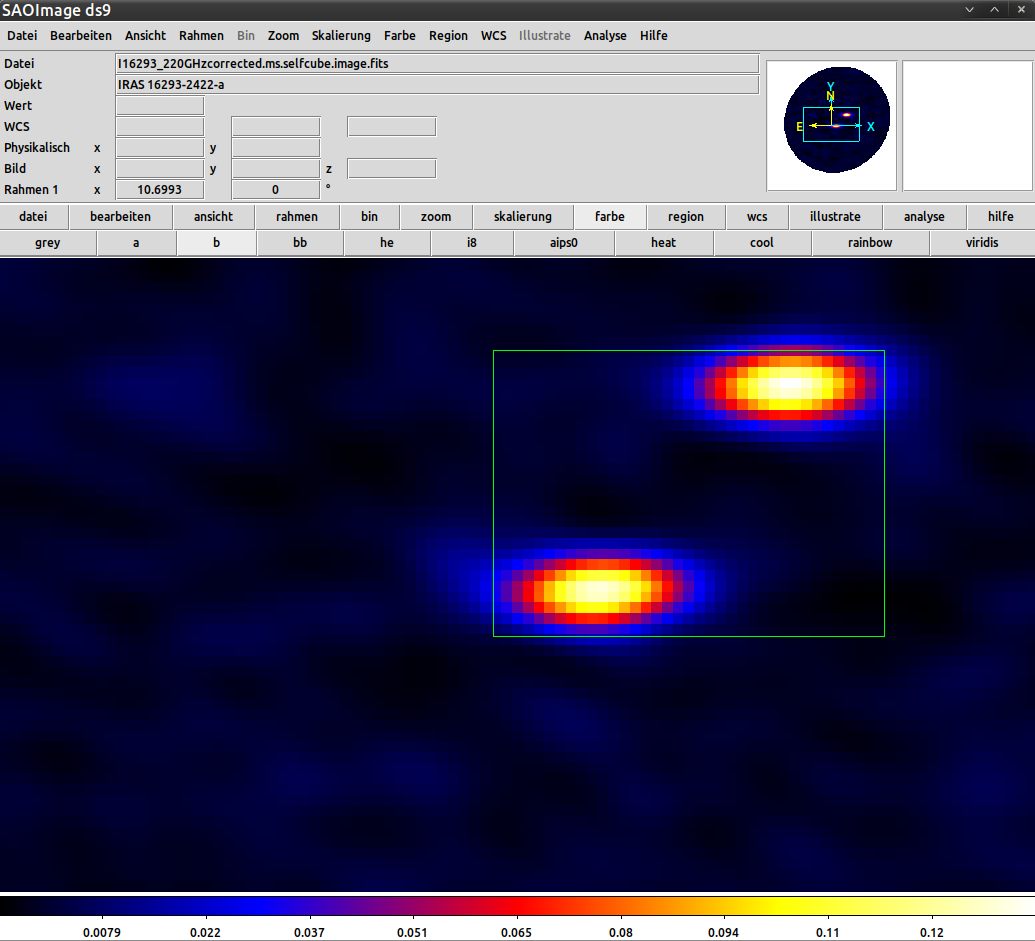
Fig. 18 The ALMA Band 6 data set from IRAS 16293 is shown together with the selected region within the ds9 program.
In order to fit only a part of the whole ALMA cube we need a region file generated by the ds9 program [1] , which is shown in Fig. 18.
ds9 region file tutorial-mapfit__region__Band_6.reg used for the
myXCLASSMapFit function:
# Region file format: DS9 version 4.1
global color=green dashlist=8 3 width=1 font="helvetica 10 normal roman" select=1 highlite=1 dash=0 fixed=0 edit=1 move=1 delete=1 include=1 source=1
fk5
box(248.0947863,-24.4762802,7.183",5.198",359.99997)
Observational xml file
For the myXCLASSMapFit function we have to define the frequency range, (here from 220.079 to 220.313 GHz), the size of the interferometric beam (here 1.777 arcsec), the background and dust parameters.
Observational xml file tutorial-mapfit__obs__Band_6.xml used for the
myXCLASSMapFit function:
<?xml version="1.0" encoding="UTF-8"?>
<ExpFiles>


   <!-- define number of experimental data file(s) -->
   <NumberExpFiles>1</NumberExpFiles>


   <!-- ****************************************************************************************** -->
   <!-- define parameters -->
   <file>
      <FileNamesExpFiles>files/data/I16293_220GHzcorrected.ms.selfcube.image.fits</FileNamesExpFiles>


      <!-- define import filter -->
      <ImportFilter>xclassFITS</ImportFilter>


      <!-- define number of frequency ranges -->
      <NumberExpRanges>1</NumberExpRanges>


      <!-- define parameters for each frequency range -->
      <FrequencyRange>
            <MinExpRange>2.20079e+5</MinExpRange>
            <MaxExpRange>2.20313e+5</MaxExpRange>
            <StepFrequency>0.1</StepFrequency>


            <!-- define t_back_flag, background temperature and temperature slope -->
            <t_back_flag>True</t_back_flag>
            <BackgroundTemperature>0.0</BackgroundTemperature>
            <TemperatureSlope>0.0</TemperatureSlope>


            <!-- define hydrogen column density, beta for dust, and kappa -->
            <HydrogenColumnDensity>1.0E+24</HydrogenColumnDensity>
            <DustBeta>0.0</DustBeta>
            <Kappa>0.0</Kappa>
      </FrequencyRange>


      <!-- define local standard of rest (vLSR) -->
      <GlobalvLSR>0.0</GlobalvLSR>


      <!-- define size of telescope -->
      <TelescopeSize>1.7769575715066</TelescopeSize>


      <!-- interferometric data -->
      <Inter_Flag>True</Inter_Flag>
   </file>


   <!-- *********************************** -->
   <!-- taken local-overlap into account? -->
   <LocalOverlap_Flag>False</LocalOverlap_Flag>


   <!-- ***************************************************************** -->
   <!-- parameters for isotopologues -->
   <iso_flag>True</iso_flag>
   <IsoTableFileName>files/tutorial-mapfit__iso-ratios.dat</IsoTableFileName>
</ExpFiles>
Molfit file
Now, we have to define a molfit file describing which molecules are taken into account and how many components are used for each molecule. But how do we identify the molecules which are included in the current frequency range? First of all we have to extract one characteristic spectrum from the region, which contains more or less all lines using the spectral_cube package [2], see below. In general it is necessary to fit different pixel spectra to create a molfit file, which can be used as initial guess for all pixel of the selected region. Now, we have to identify the molecules included in the selected spectrum. One possibility is to use the GetTransition function and identify the molecules which have the strongest transitions with the lowest lower energies. Another possibility is to apply the LineID function, see Sect. “LineID”. Here, we used the GetTransition function, see Sect. “GetTransitions”, because the frequency range is quite narrow so that the LineID function would not produce reliable results.
Use GetTransitions function to find molecules:
>>> from xclass import task_GetTransitions
>>> from astropy import units as u
>>> from spectral_cube import SpectralCube
>>> import numpy as np

# get min. and max. frequency from FITS data cube directly
>>> ObsDataFileName = "files/data/I16293_220GHzcorrected.ms.selfcube.image.fits"
>>> cube = SpectralCube.read(ObsDataFileName)
>>> cube2 = cube.with_spectral_unit(u.MHz)

# get spectrum at the central position
# the order of the dimensions is always (n_spectral, n_y, n_x)
>>> nu, dec, ra = cube2.world[:]
>>> pos_ra = int(len(ra[0, 0, :]) / 2)
>>> pos_dec = int(len(dec[0, :, 0]) / 2)
>>> obsdata = cube2[:, pos_ra, pos_dec].value
>>> obsdata = np.vstack((nu[:, 0, 0].value, obsdata)).T

# define other input parameters for GetTransitions function
>>> SelectMolecule = []
>>> ElowMin = 0.0
>>> ElowMax = 3000.0

# call GetTransitions function
>>> task_GetTransitions.GetTransitionsCore(obsdata = obsdata, \
                                           SelectMolecule = SelectMolecule, \
                                           ElowMin = ElowMin, \
                                           ElowMax = ElowMax)
In this example we use the spectral_cube package to extract the spectrum of the central pixel of the data cube. In the following, this spectrum is used to call the GetTransitions function, which offers the possibility to use the mouse in combination with the right mouse button to define the central frequency (blue vertical line) of a frequency range (grey vertical bar), which is used for the database query. Note, the width of the range can be enlarged (shrinked) by pressing the “+” (“-”) key. In the following, XCLASS prints out information of all transitions within the selected frequency range to the screen, starting with the transition with the lowest transition frequency. In order to sort the transitions by lower energies, the user has to press the “1” key before selecting the central frequency. Using the “2” (“3”) key, sorts the transitions by the Einstein A coefficients (by a products of upper state degeneracies and Einstein A coefficients (gA)). Pressing the “0” key restores the initial order, i.e. by transition frequencies. Note, the GUI has to be closed to stop the function!
We identify the molecules:
CH\(_3\)CN\(_{v=0}\) and
CH\(_3\)OCHO\(_{v=0}\). Now, we have to find initial values
for each component and parameter. The source size for both molecules can
be computed from the area of a pixel. The header of the data cube indicates
the step size in degree along the RA (CDELT1) and DEC (CDELT2) axis,
respectively.
CDELT1  =  -5.555555555556E-05
CDELT2  =   5.555555555556E-05
This gives an area of \(A = 0.04\) arcsec\(^2\). We assume that both components cover an equal area, which gives a source size \(\theta\) of
Furthermore, we assume a temperature of 100 K, a column density of \(1 \cdot 10^{14}\) cm\(^{-2}\), a line width of 5 km/s, and an offset velocity of 0 km/s.
The molfit file tutorial-mapfit__Band_6.molfit used for the
myXCLASSMapFit function:
% Number of molecules   3
%
% schema:
%
% name of molecule   number of components
%  f:   low:    up:    s_size:   f:   low:      up:      T_rot:   f:      low:       up:        N_tot:   f:  low:    up:  V_width:   f:    low:    up:    V_off:   CF-Flag:
%--------------------------------------------------------------------------------------------------------------------------------------------------------------------------
%
% detected molecules
%
%--------------------------------------------------------------------------------------------------------------------------------------------------------------------------
CH3CN;v=0;    1
  n    0.0      0.0     0.2257    y  10.00  1000.00   150.00000    y   1.0e+11    1.0e+18    1.0e+14    y   1.0   10.0       5.0    y    -9.0    9.0       0.0   c
CH3OCHO;v=0;  1
  n   1.00  1000.00     0.2257    y   3.00  1000.00   150.00000    y   1.0e+11    1.0e+18    1.0e+14    y   1.0   10.0       5.0    y    -9.0    9.0       0.0   c
Iso ratio file
Here, we take the following isotopologues and vibrational excited molecules into account CH\(_3\)O\(^{13}\)CHO\(_{v18=1}\), CH\(_3\)OCHO\(_{v18=1}\), CH\(_3\)O\(^{13}\)CHO\(_{v=0}\), CH\(_3\)CN\(_{v8=1}\), \(^{13}\)CH\(_3\)CN\(_{v=0}\), CH\(_3^{13}\)CN\(_{v=0}\), and CH\(_3\)C\(^{15}\)N \(_{v=0}\).
The iso-ratio file tutorial-mapfit__iso-ratios.dat used for the
myXCLASSMapFit function:
% Isotopologue:          Iso-master:         Iso-ratio:     Lower-limit:      Upper-limit:
CH3OC-13-HO;v18=1;       CH3OCHO;v=0;             28.00             1.00              1.00
CH3OCHO;v18=1;           CH3OCHO;v=0;              1.00             1.00              1.00
CH3OC-13-HO;v=0;         CH3OCHO;v=0;             28.00             1.00              1.00
CH3CN;v8=1;              CH3CN;v=0;                1.00             1.00              1.00
C-13-H3CN;v=0;           CH3CN;v=0;               16.00             1.00              1.00
CH3C-13-N;v=0;           CH3CN;v=0;               16.00             1.00              1.00
CH3CN-15;v=0;            CH3CN;v=0;              300.00             1.00              1.00
Algorithm xml file
In order to fit the parameters we used in the molfit file we have to define
the optimization algorithm(s) which is (are) used by the myXCLASSMapFit
function. Here, we use the trf algorithm, where we want to limit
the number of iterations per pixel to 10 by setting the tag
"<number_iterations>" to 10. Furthermore, we define another stopping criterion
by setting the upper limit of the \(\chi^2\) function to 1.e-6,
using the tag "<limit_of_chi2>". Additionally, we want to fit 11 pixels in
parallel, which is described by tag "<NumberProcessors>".
Algorithm xml file tutorial-mapfit__algorithm.xml used for the
myXCLASSMapFit function:
<?xml version="1.0" encoding="UTF-8"?>
<FitControl>
   <!-- settings for fit process -->


   <!-- set number of used algorithms -->
   <NumberOfFitAlgorithms>1</NumberOfFitAlgorithms>


   <!-- define settings for 1st algorithm -->
   <algorithm>
      <FitAlgorithm>trf</FitAlgorithm>


      <!-- define value of the variation -->
      <VariationValue>1.e-3</VariationValue>


      <!-- set max. number of iterations -->
      <number_iterations>10</number_iterations>


      <!-- set max. number of processors -->
      <NumberProcessors>11</NumberProcessors>


      <!-- settings for chi^2 -->
      <limit_of_chi2>1e-6</limit_of_chi2>
      <RenormalizedChi2>yes</RenormalizedChi2>
      <DeterminationChi2>default</DeterminationChi2>
      <SaveChi2>yes</SaveChi2>


      <!-- set plot options -->
      <PlotAxisX>Rest Frequency [MHz]</PlotAxisX>
      <PlotAxisY>T_mb [K]</PlotAxisY>
      <PlotIteration>no</PlotIteration>
   </algorithm>
</FitControl>
Call of myXCLASSMapFit function
Now everything is prepared to start the myXCLASSMapFit function. Note, we do not use a cluster file here, i.e. we use only one computer.
The myXCLASSMapFit function reads in the data cube, extracts the spectra for each pixel and fits these spectra separately using the trf algorithm. At the end of the whole fit procedure, the myXCLASSMapFit function creates FITS images for each fit parameter of the best fit, where each pixel corresponds to the value of the optimized parameter taken from the best fit for this pixel.
The myXCLASSMapFit function offers the possibility to use smoothed parameter maps to improve the results of a previous myXCLASSMapFit run, i.e. after finishing the first myXCLASSMapFit run, the created parameter maps are smoothed using one of the following smoothing algorithms
multidimensional Gaussian filter [3] ,
multidimensional uniform filter [4] ,
multidimensional median filter [5] ,
where the degree of smoothing is controlled by an additional user input parameter, respectively. The values of the smoothed parameter maps are used in a second myXCLASSMapFit run as initial parameters, where the parameters in the molfit files at each fitted pixel position are updated by the values of the smoothed maps. The whole procedure is repeated as many times as specified by the user.
Here, we use the multidimensional uniform filter with size 6 and set the number of smooth iterations to 2.
Start myXCLASSMapFit function
>>> from xclass import task_myXCLASSMapFit
>>> import os

## get path of current directory
>>> LocalPath = os.getcwd() + "/"

# define path and name of molfit file
>>> MolfitsFileName = LocalPath + "files/tutorial-mapfit__Band_6.molfit"

# define path and name of obs. data file
>>> ObsXMLFileName = LocalPath + "files/tutorial-mapfit__obs__Band_6.xml"

# define path and name of algorithm xml file
>>> AlgorithmXMLFileName = LocalPath + "files/tutorial-mapfit__algorithm.xml"

## use fast-fitting method?
>>> FastFitFlag = True

## use full-fitting method?
>>> FullFitFlag = False

# define path and name of region file
>>> regionFileName = LocalPath + "files/tutorial-mapfit__region__Band_6.reg"

# define lower limit for intensity (pixel with max. intensity below given
# limit are ignored)
>>> Threshold = 0.0

# define number of iterations to smooth parameter maps
>>> ParamMapIterations = 2

# define parameter used for smoothing
>>> ParamSmoothMethodParam = 6.0

# define scipy method ("gaussian", "uniform", "median") used for parameter
# map smoothing
>>> ParamSmoothMethod = "uniform"

# define path of a directory containing FITS images describing parameter
# maps to update the parameter defined in the molfit file for each pixel
>>> ParameterMapDir = ""

# call myXCLASSMapFit function
>>> JobDir = task_myXCLASSMapFit.myXCLASSMapFitCore( \
                                   MolfitsFileName = MolfitsFileName, \
                                   ObsXMLFileName = ObsXMLFileName, \
                                   FastFitFlag = FastFitFlag, \
                                   FullFitFlag = FullFitFlag, \
                                   AlgorithmXMLFileName = AlgorithmXMLFileName, \
                                   regionFileName = regionFileName, \
                                   Threshold = Threshold, \
                                   ParameterMapDir = ParameterMapDir, \
                                   ParamMapIterations = ParamMapIterations, \
                                   ParamSmoothMethodParam = ParamSmoothMethodParam, \
                                   ParamSmoothMethod = ParamSmoothMethod)

# start myXCLASSMapFit GUI
>>> task_myXCLASSMapFit.StartPlottingGUI(JobDir)
Here, the myXCLASSMapFit-GUI, see Sect. “myXCLASSMapFit GUI”, is used to visualize the results of the myXCLASSMapFit function.
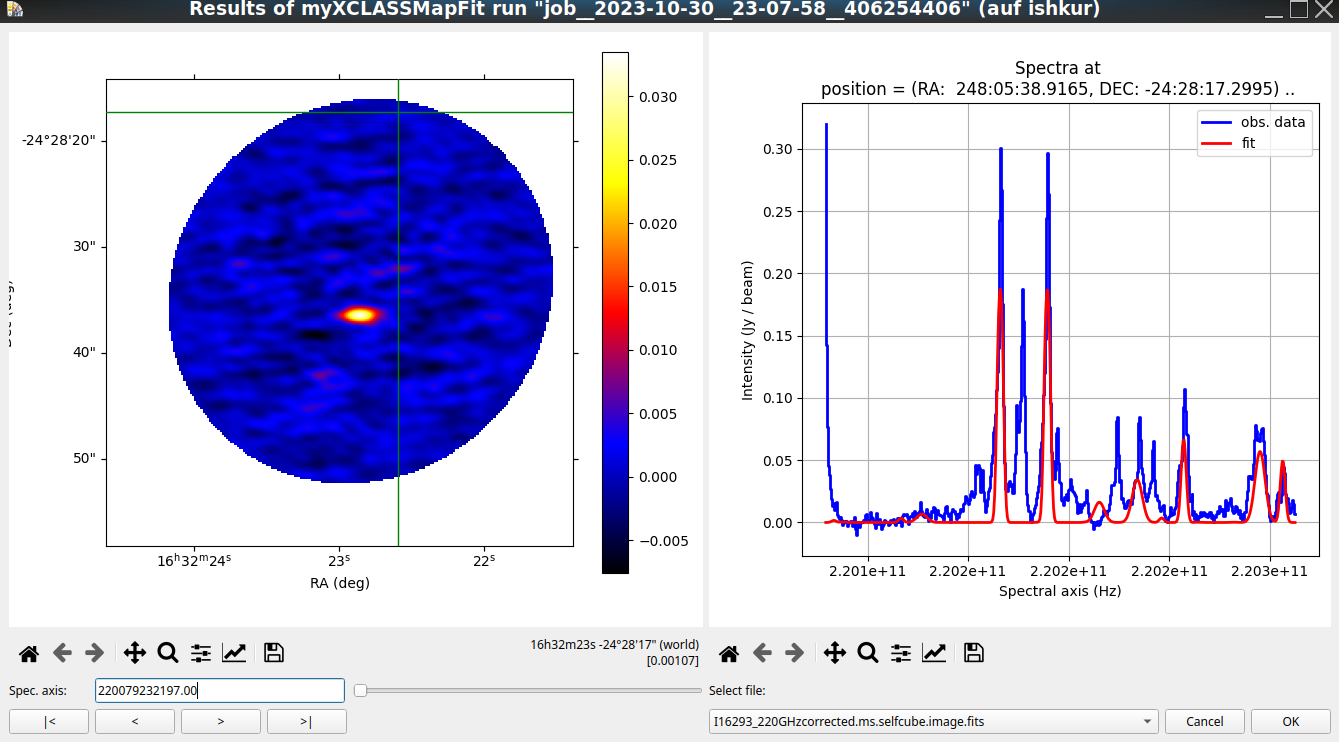
Fig. 19 The myXCLASSMapFit-GUI visualizes the observational data (blue line) together with the synthetic spectra (red line) for each pixel.
Results
After finishing the fits of the selected pixels the myXCLASSMapFit function produces a couple of FITS images describing the optimized fit parameters for each pixel and the quality of the each pixel fit.
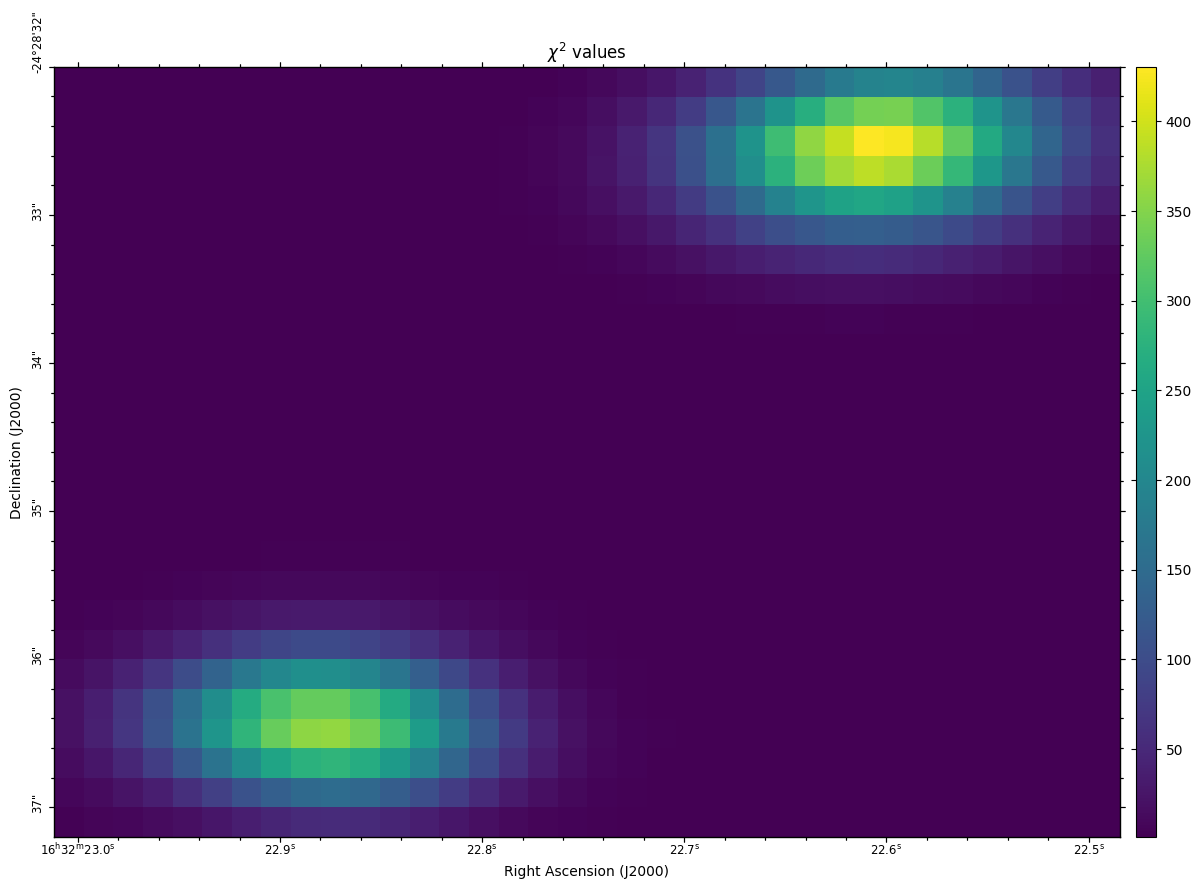
Fig. 20 The \(\chi^2\) values, i.e. the summed squared differences for each pixel, after the second iteration.
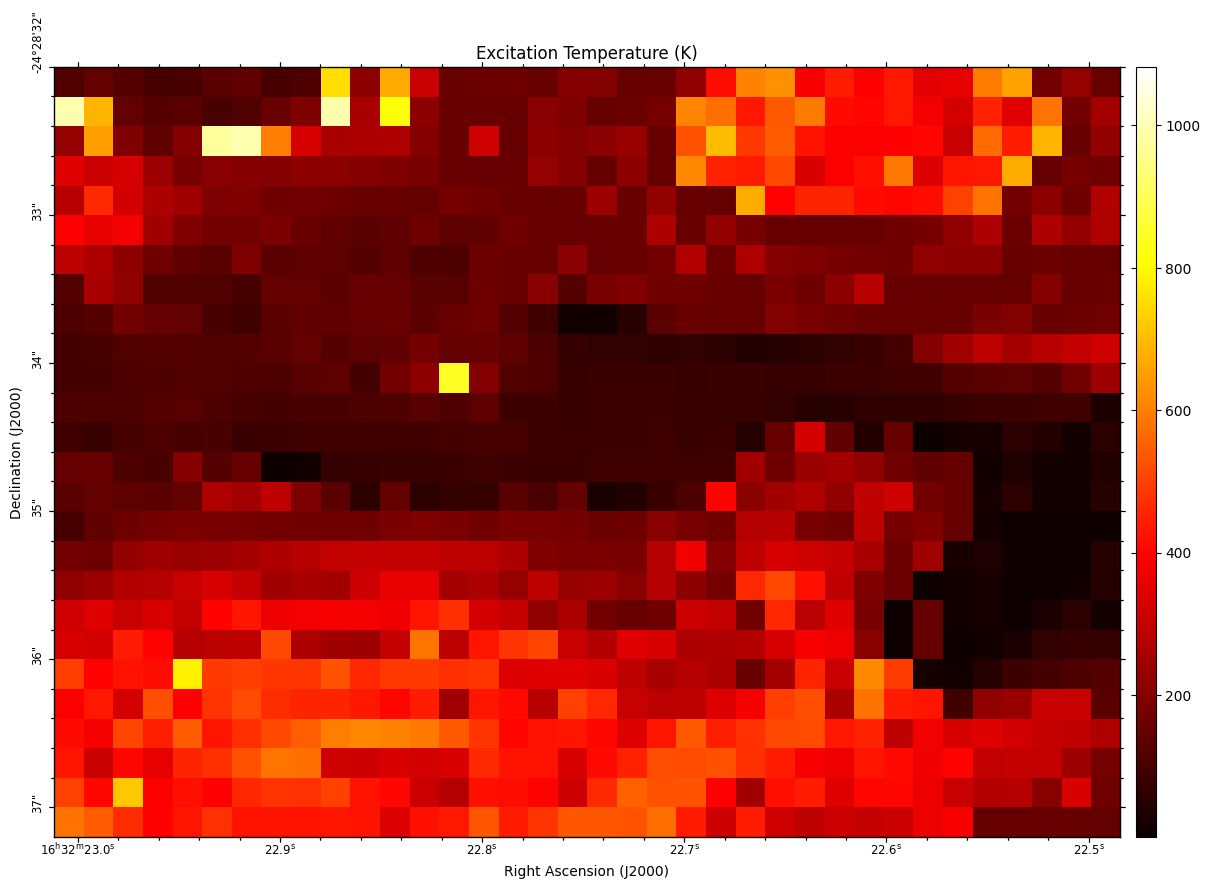
Fig. 21 Derived temperature map of CH\(_3\)CN after the first iteration.

Fig. 22 Derived temperature map of CH\(_3\)CN after the second iteration.

Fig. 23 Derived temperature map of CH\(_3\)OCHO after the second iteration.