Database
The database with XCLASS provides all the molecular data required to fit the spectra, including excitation energies, partition functions, Einstein A-coefficients etc. The underlying basis comes from a variety of sources, but primarily CDMS.
The XCLASS database file is stored at
/path-to-user-home-directory/.xclass/.db/
To successfully customize a molecule, the name specified in the input files must match the entry in the database. This is not always trivial to determine as permutations in notation, specification of vibrational, ortho-para, A-E, etc. and multiple versions of entries may exist. The database functions provide a way to ensure these are matched.
The XCLASS database contains two tables:
partitionfunctions,
transitions.
They have 121 and 12 columns respectively. The database format can be
read by SQLite3. The database may also be browsed by several available
third party tools. A useful example for Linux is sqliteman. For Ubuntu
distributions (tested on 18.04), it can be installed by
$ sudo apt-get update -y
$ sudo apt-get install -y sqliteman
UpdateDatabase
This function updates the XCLASS database file located in the .xclass/db/
subdirectory located in the user’s home directory from spectroscopic
databases connected to the Virtual Atomic and Molecular Datacentre,
VAMDC (www.vamdc.eu). Currently, data access to the CDMS database and
the JPL catalog, is supported.
Example call of the UpdateDatabase function to download a new database file from the CDMS server:
>>> from xclass import task_UpdateDatabase

# call UpdateDatabase function
>>> DBUpdateNew = "new"
>>> task_UpdateDatabase.UpdateDatabase(DBUpdateNew)
DatabaseQuery
This function sends a given SQL query string to the XCLASS database.
Example call of the DatabaseQuery function:
>>> from xclass import task_DatabaseQuery

# call DatabaseQuery function
>>> QueryString = "select PF_Name from Partitionfunctions"
>>> Contents = task_DatabaseQuery.DatabaseQuery(QueryString)
Please note, in the example described above, all names stored in table “Partitionfunctions” are saved in the output variable “Contents”. Here, “Contents[0]” includes the first name and so on.
ListDatabase
This function reads in entries from the table transitions located in the SQLite3 database file and prints
out the contents to the screen or file (defined by the input parameter OutputDevice). The user can limit
the output by defining a minimum and maximum for the frequency (or for the lower energy) for the transitions.
Example call of the ListDatabase function:
>>> from xclass import task_ListDatabase

# call ListDatabase function
>>> FreqMin = 20000.0
>>> FreqMax = 20100.0
>>> ElowMin = 100.0
>>> ElowMax = 2000.0
>>> SelectMolecule = []
>>> OutputDevice = " "
>>> Contents = task_ListDatabase.ListDatabase(FreqMin, FreqMax, ElowMin, \
                                              ElowMax, SelectMolecule, \
                                              OutputDevice)
GetTransitions
Similar to the ListDatabase function, the GetTransitions function displays information from the embedded database
about transitions within a user-defined frequency range. Here, the frequency range selection is done in an
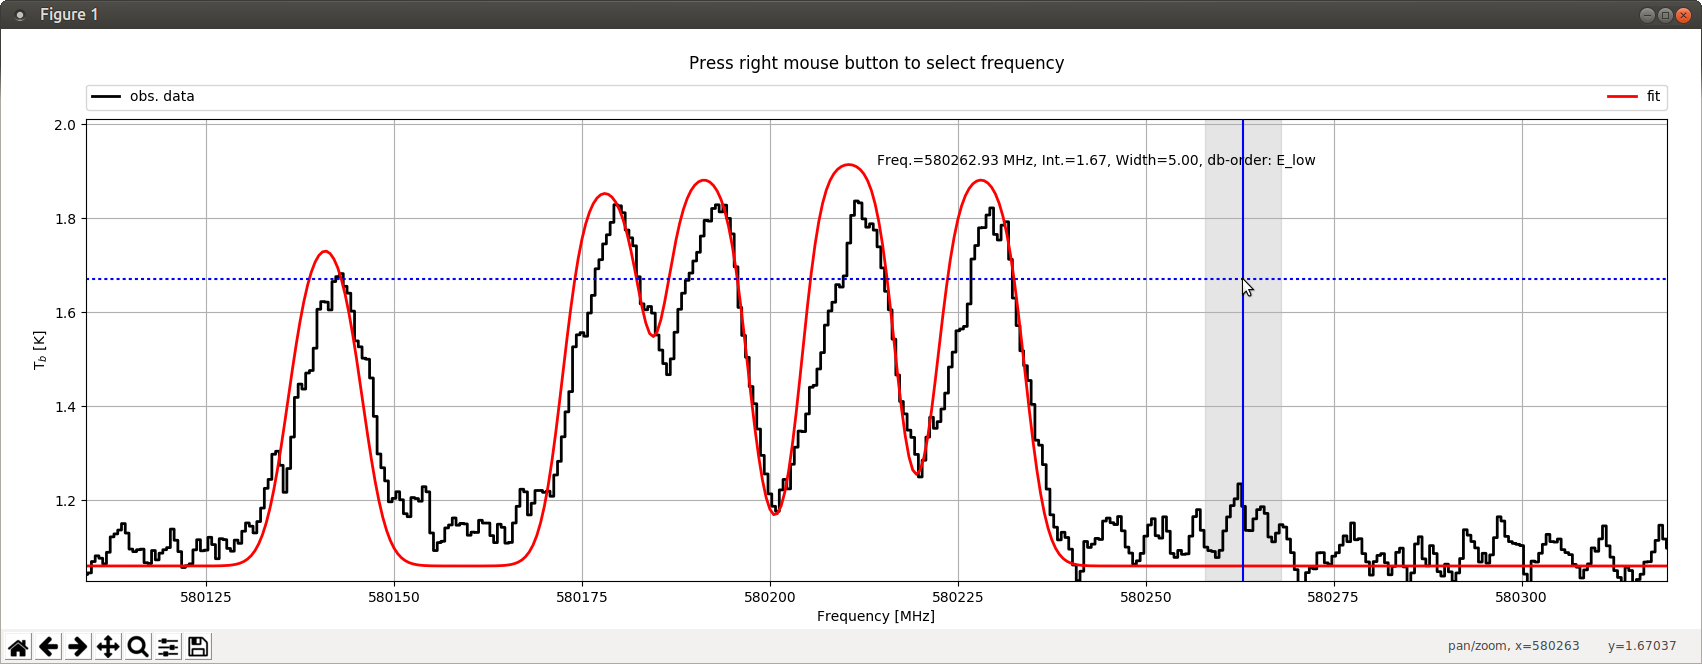
interactive way. Therefore, the GetTransitions function starts a graphical user interface (GUI) which describes
observational data (defined by parameter obsdata) within a frequency range defined by the parameters FreqMin and
FreqMax. Additionally, the function offers the possibility to plot a synthetic spectrum (defined by parameter
modeldata) of a previous myXCLASS or myXCLASSFit function call as well. By using the mouse in combination with
the right mouse button, the user defines the central frequency (blue vertical line) of the frequency range (grey
vertical bar) which is used for the database query. The initial half width of this range is defined by parameter
FrequencyWidth. Note, the width of the range can be enlarged (shrinked) by pressing the “+” (“-”) key. In the
following, XCLASS prints out information of all transitions within the selected frequency range to the screen,
starting with the transition with the lowest transition frequency. In order to sort the transitions by lower
energies, the user has to press the “1” key before selecting the central frequency. Using the “2” (“3”) key,
sorts the transitions by the Einstein A coefficients (by a products of upper state degeneracies and Einstein A
coefficients (gA)). Pressing the “0” key restores the initial order, i.e. by transition frequencies. Additionally,
the user can reduce the number of transitions by defining a lower and a upper limit for the lower energies using
parameters ElowMin and ElowMax, respectively. Furthermore, the screen output can be limited to a few molecules by
using parameter SelectMolecule. Note, the GUI has to be closed to stop the function!
Example call of the GetTransitions function
>>> from xclass import task_LoadASCIIFile
>>> from xclass import task_GetTransitions
>>> from xclass import task_myXCLASS

# use myXCLASS function to create synthetic spectrum
>>> FreqMin = 580102.0
>>> FreqMax = 580546.5
>>> FreqStep = 0.5
>>> TelescopeSize = 3.5
>>> Inter_Flag = False
>>> t_back_flag = True
>>> tBack = 1.06
>>> tSlope = 0.0
>>> N_H = 3.e+20
>>> beta_dust = 2.0
>>> kappa_1300 = 0.02
>>> MolfitsFileName = XCLASSBaseDir + "demo/myXCLASS/CH3OH__pure.molfit"
>>> iso_flag = True
>>> IsoTableFileName = XCLASSBaseDir + "demo/myXCLASS/iso_names.txt"
>>> LocalOverlapFlag = False
>>> NoSubBeamFlag = True
>>> modeldata, log, TransEnergies, IntOpt, jobDir = task_myXCLASS.myXCLASSCore( \
                                                FreqMin = FreqMin, \
                                                FreqMax = FreqMax, \
                                                FreqStep = FreqStep, \
                                                MolfitsFileName = MolfitsFileName, \
                                                iso_flag = iso_flag, \
                                                IsoTableFileName = IsoTableFileName, \
                                                TelescopeSize = TelescopeSize, \
                                                Inter_Flag = Inter_Flag, \
                                                t_back_flag = t_back_flag, \
                                                tBack = tBack, \
                                                tSlope = tSlope, \
                                                N_H = N_H, \
                                                beta_dust = beta_dust, \
                                                kappa_1300 = kappa_1300, \
                                                LocalOverlapFlag = LocalOverlapFlag, \
                                                NoSubBeamFlag = NoSubBeamFlag, \
                                                printFlag = True)

# use LoadASCIIFile function to import obs . data
>>> FileName = XCLASSBaseDir + "demo/myXCLASS/band1b.dat"
>>> NumHeaderLines = 1
>>> RestFreq = 0.0
>>> vLSR = 0.0
>>> obsdata = task_LoadASCIIFile.LoadASCIIFile(FileName, NumHeaderLines, \
                                               RestFreq, vLSR)


# call GetTransitions function
>>> SelectMolecule = []
>>> FrequencyWidth = 5.0
>>> ElowMin = 0.0
>>> ElowMax = 3000.0
>>> task_GetTransitions.GetTransitions(obsdata, FreqMin, FreqMax, \
                                       SelectMolecule, FrequencyWidth, \
                                       ElowMin, ElowMax, modeldata )