myXCLASSFit and error estimation
The purpose of this tutorial is to describe how to estimate the errors of the model parameters, described in molfit (and iso ratio) file using the myXCLASSFit function, see Sect. “myXCLASSFit”.
All files used within this tutorial can be downloaded here.
Error estimation
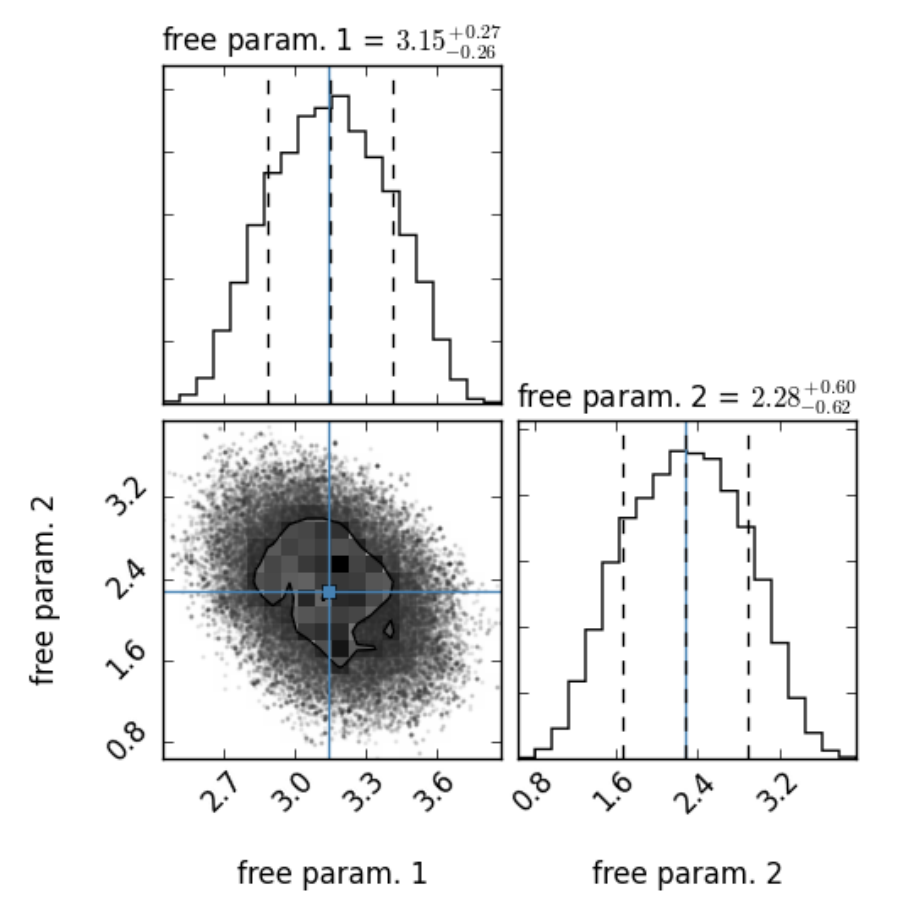
Fig. 15 Example of a so-called corner plot created with the corner package. On top of each column the probability distribution for each free parameter is shown. The left and right dashed lines indicates the lower and upper limit of the corresponding HPD interval, respectively. The dashed line in the middle indicates the mode of the distribution. The blue lines indicate the parameter values of the best fit, calculated in previously applied optimization algorithm(s). The plot in the lower left corner describes the projected 2D histograms of two parameters. The contours indicate the HPD region.
XCLASS offers the possibility to estimate the errors of the model parameters by using the emcee [1] (MCMC) or the ultranest [2] package, or the interval nested sampling algorithm. In this tutorial, we use the MCMC method to determine the errors of a previous fit.
The emcee (or MCMC) method starts at the estimated maximum \(\vec{\theta}_0\) of the likelihood function, i.e. at the parameter values of the best fit, calculated in previously applied optimization algorithm(s), and draws \(M\) samples of model parameters \(\left\{\vec{\theta}_1, \ldots, \vec{\theta}_M \right\}\) from the likelihood function in a small ball around the a priori preferred position. After finishing the algorithm the probability distribution and the corresponding highest posterior density (HPD) interval of each free parameter is calculated. Additionally, the corner package [3] is used to plot each one- and two-dimensional projection of the sample to reveal covariances, see Fig. 15.
Before we describe the calculation of the HPD intervals in detail, we briefly summarize some important statistical expressions.
We start with the cumulative distribution function (CDF) of the standard normal distribution which is given as
In statistics one often uses the related error function, or \(\erf(x)\), defined as the probability of a random variable with normal distribution of mean 0 and variance 1/2 falling in the range \([-x, x ]\) that is
The two functions are closely related, namely
For a generic normal distribution \(f\) with mean \(\mu\) and deviation \(\sigma\), the cumulative distribution function (CDF) for standard score \(z = \left(\frac{x - \mu}{\sigma}\right)\) is
Following the so-called 68-95-99.7 (empirical) rule, or 3-sigma rule, about 68 % of values drawn from a normal distribution are within one standard deviation \(\sigma\) away from the mean; about 95.4 % of the values lie within two standard deviations; and about 99.7 % are within three standard deviations.
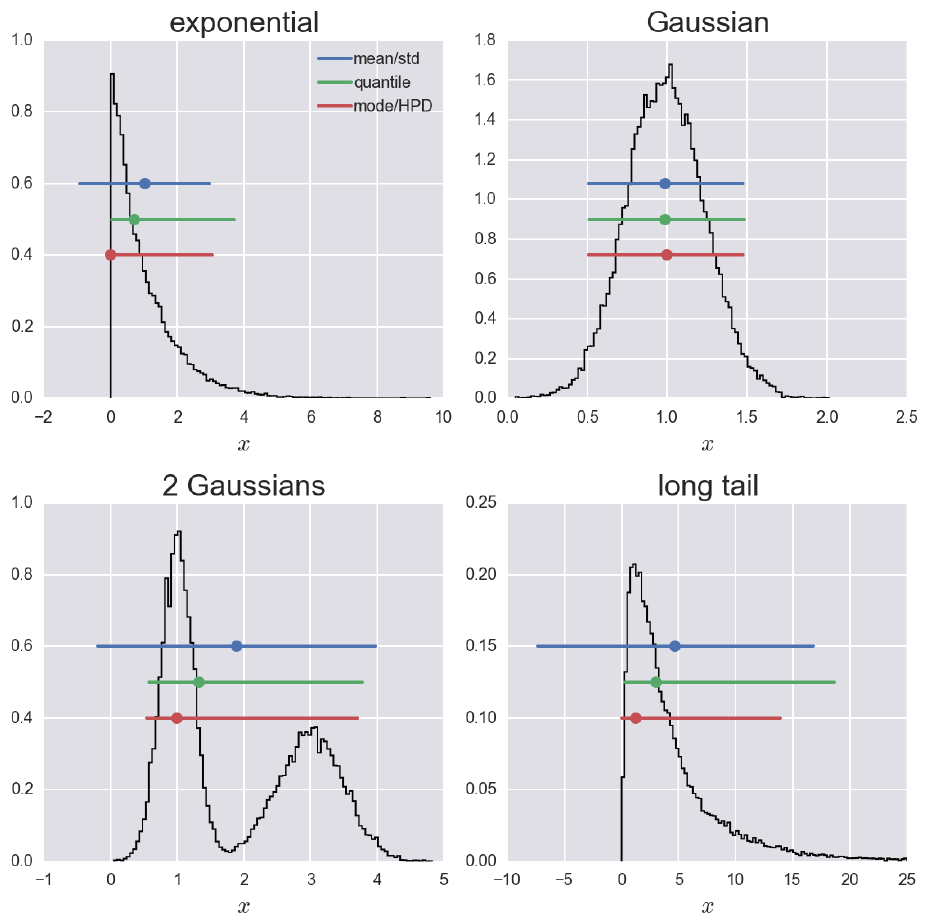
Fig. 16 Three commonly used ways of plotting a value plus error bar for a 95 % credible region for four different probability distributions [6] : 1.) Mean ± standard deviation (blue line): The most commonly used confidence interval is \(\mu \pm k \sigma\), where k is chosen to give the appropriate confidence interval, assuming the posterior is Gaussian. Here, k = 1.96. 2.) Median with quantile (green line): The posterior need not be Gaussian. If it is not, we would like a more robust way to summarize it. A simple method is to report the median, and then give lower and upper bounds to the error bar based on quantile. For a 95 % credible region we would report the 2.5th percentile and the 97.5th percentile. 3.) Mode with HPD (red line): This method uses the highest posterior density (HPD) interval. If we’re considering a 95 % confidence interval, the HPD interval is the shortest interval that contains 95 % of the probability of the posterior.
More precisely, the probability that a normal deviate lies in the range \(\mu - n \sigma\) and \(\mu + n \sigma\) is given by
As mentioned above, the error estimation algorithm calculates the highest posterior density (HPD) interval of each parameter, respectively. A HPD interval is basically the shortest interval on a posterior density for some given confidence level, i.e. 68 % for 1\(\sigma\), 95.4 % for 2\(\sigma\) etc. For example, if we’re considering a 95.4 % (or 2\(\sigma\)) confidence interval, the HPD interval is the shortest interval that contains 95.4 % of the probability of the posterior. Mathematically a \(100 \cdot (1 - P(n))\) % HPD interval (or region) for a subset \(\mathcal{C} \in \Theta\) defined by
where \(k\) is the largest number such that
The value \(k\) can be thought of as a horizontal line placed over the posterior density whose intersection(s) with the posterior define regions with probability \(1 - P(n)\), see Fig. 16. In order to compute a HPD interval we rank-order the MCMC trace. We know that the number of samples that are included in the HPD is 0.954 (or another confidence level) times the total number of MCMC sample. We then consider all intervals that contain that many samples and find the shortest one. In the case of a normal distribution an HPD interval coincides with the usual probability region symmetric about the mean, spanning the \(\frac{n \, \sigma}{2}\) and \(1 - \frac{n \, \sigma}{2}\) quantiles [4]. The same is true for any unimodal, symmetric distribution, see Fig. 16.
So, the error estimation algorithm reports the (first) mode [5] and then the bounds on the HPD intervals, see Fig. 15. Note, the mode must not coincidence with the best fit result of the previously applied algorithms!
Please note, the calculated HPD intervals are credible intervals not confidence intervals. In Bayesian statistics, a credible interval is an interval in the domain of a posterior probability distribution or predictive distribution used for interval estimation. The generalization to multivariate problems is the credible region. Credible intervals are analogous to confidence intervals in frequentist statistics, although they differ on a philosophical basis; Bayesian intervals treat their bounds as fixed and the estimated parameter as a random variable, whereas frequentist confidence intervals treat their bounds as random variables and the parameter as a fixed value. (Taken from https://en.wikipedia.org/wiki/Credible_interval).
Observational xml file
For the myXCLASSFit function we have to define the frequency range, (here from 219.764240 to 221.471740 GHz), the size of the interferometric beam (here 0.38 arcsec), the background and dust parameters.
Observational xml file tutorial-error__obs.xml used for the
myXCLASSMapFit function:
<?xml version="1.0" encoding="UTF-8"?>
<ExpFiles>


   <!-- define number of experimental data file(s) -->
   <NumberExpFiles>1</NumberExpFiles>


   <!-- ****************************************************************** -->
   <!-- define parameters for first file -->
   <file>


      <!-- define path and name of first data file -->
      <FileNamesExpFiles>files/data/observed_spectrum.dat</FileNamesExpFiles>


      <!-- define import filter -->
      <ImportFilter>xclassASCII</ImportFilter>


      <!-- define number of frequency ranges for first data file -->
      <NumberExpRanges>1</NumberExpRanges>


      <!-- define parameters for each frequency range -->
      <FrequencyRange>
            <MinExpRange>219764.240</MinExpRange>
            <MaxExpRange>221471.740</MaxExpRange>
            <StepFrequency>2.5</StepFrequency>


            <!-- define background temperature and temperature slope -->
            <t_back_flag>True</t_back_flag>
            <BackgroundTemperature>0.0</BackgroundTemperature>
            <TemperatureSlope>0.0</TemperatureSlope>


            <!-- define hydrogen column density, beta for dust, and kappa -->
            <HydrogenColumnDensity>1.00E+24</HydrogenColumnDensity>
            <DustBeta>0.0</DustBeta>
            <Kappa>0.0</Kappa>
      </FrequencyRange>


      <!-- define size of telescope -->
      <TelescopeSize>0.38</TelescopeSize>


      <!-- define local standard of rest (vLSR) -->
      <GlobalvLSR>0.0</GlobalvLSR>


      <!-- define if interferrometric observation is modeled -->
      <Inter_Flag>True</Inter_Flag>


      <!-- define parameters for ASCII file import -->
      <ErrorY>no</ErrorY>
      <NumberHeaderLines>0</NumberHeaderLines>
      <SeparatorColumns> </SeparatorColumns>
   </file>


   <!-- *************************************************************** -->
   <!-- parameters for isotopologues -->
   <Isotopologues>True</Isotopologues>
   <IsoTableFileName>files/tutorial-error__iso-ratio.dat</IsoTableFileName>


   <!-- *********************************** -->
   <!-- take local-overlap into account -->
   <LocalOverlap_Flag>False</LocalOverlap_Flag>


   <!-- **************************** -->
   <!-- prevent sub-beam description -->
   <NoSubBeam_Flag>True</NoSubBeam_Flag>
</ExpFiles>
Molfit file
The molfit file tutorial-error__Band_6.molfit used for the
myXCLASSFit function:
%=======================================================================================================================================================================================================================================================================
%
% define database parameters:
%
%=======================================================================================================================================================================================================================================================================
%%MinNumTransitionsSQL = 1                % (min. number of transitions)
%%MaxNumTransitionsSQL = 90000            % (max. number of transitions)
%%MaxElowSQL = 8.000e+03                  % (max. lower energy, i.e. upper limit of the lower energy of a transition)
%%MingASQL = 1.000e-09                    % (minimal intensity, i.e. lower limit of gA of a transition)
%%TransOrderSQL = 1                       % (order of transitions: (=1): by lower energy, (=2) by gA, (=3) gA/E_low^2, else trans. freq.)


%=======================================================================================================================================================================================================================================================================
%
% define molecules and their components:
%
%=======================================================================================================================================================================================================================================================================
% f:  low:   up:  s_size:   f:  low:    up:   T_rot:   f:      low:        up:     N_tot:   f:  low:   up:  V_width:   f:  low:   up:   V_off:  cfFlag:
%
CH3CN;v=0;   1
   y   0.1  20.0      3.0    y  50.0  550.0    300.0    y  1.00e+14   1.00e+20   2.00e+15    y   4.0  12.0       8.0   y   -2.0  +2.0     -0.3  c
Iso ratio file
In addition to CH\(_3\)CN\(_{v=0}\), which is used in the molfit file, we take the following isotopologues and vibrational excited molecules into account: CH\(_3\)CN\(_{v8=1}\), \(^{13}\)CH\(_3\)CN\(_{v=0}\), CH\(_3^{13}\)CN\(_{v=0}\), CH\(_3\)C\(^{15}\)N\(_{v=0}\),
The iso-ratio file tutorial-error__iso-ratio.dat used for the
myXCLASSFit function:
% Isotopologue:      Iso-master:        Iso-ratio:      Lower-limit:      Upper-limit:
CH3CN;v8=1;          CH3CN;v=0;                  1
C-13-H3CN;v=0;       CH3CN;v=0;                 16
CH3C-13-N;v=0;       CH3CN;v=0;                 16
CH3CN-15;v=0;        CH3CN;v=0;                300
Algorithm xml file
Here, we use a combination of two algorithms, a so-called algorithm chain. We
start with the trf algorithm with max. 80 iterations and 6 cores to fit
the observational data. In the following, we estimate the errors of the
parameters optimized by the trf algorithm using the MCMC algorithm
(tab <ErrorMethod>) with 20 samplers (tag <NumberMCMCSampler>), 5
burn in iterations (tag <NumberBurnInIter>), and 10 final iterations
(tag <number_iterations>). Additionally, we will compute HPD intervals
(tag <ErrorType>) with a \(2 \, \sigma\) range
(tag <MultiplicitySigma>). We do not use a backend file
(tag <BackendFileName>).
Note that we actually use far too few samples and iterations here to get a
really good error estimate. It is possible that sometimes a "RuntimeError"
is displayed, which is caused by insufficient sampling. It may therefore be
necessary to increase the number of samples (described by tag
NumberMCMCSampler) to e.g. 40 and the number of iterations (described
by tag number_iterations in the second algorithm) to e.g. 1000.
However, depending on the used computer, this can take quite a long time.
Algorithm xml file tutorial-error__algorithm.xml used for the
myXCLASSFit function:
<?xml version="1.0" encoding="UTF-8"?>
<FitControl>
   <!-- settings for fit process -->


   <!-- set number of used algorithms -->
   <NumberOfFitAlgorithms>2</NumberOfFitAlgorithms>


   <!-- define settings for 2nd algorithm -->
   <algorithm>
      <FitAlgorithm>trf</FitAlgorithm>


      <!-- set max. number of iterations -->
      <number_iterations>80</number_iterations>


      <!-- set max. number of processors -->
      <NumberProcessors>6</NumberProcessors>


      <!-- settings for chi^2 -->
      <limit_of_chi2>1e-6</limit_of_chi2>
      <RenormalizedChi2>yes</RenormalizedChi2>
      <DeterminationChi2>default</DeterminationChi2>
      <SaveChi2>yes</SaveChi2>


      <!-- set plot options -->
      <PlotAxisX>Rest Frequency [MHz]</PlotAxisX>
      <PlotAxisY>T_mb [K]</PlotAxisY>
      <PlotIteration>no</PlotIteration>
   </algorithm>


   <!-- define settings for 2nd algorithm -->
   <algorithm>
      <FitAlgorithm>errorestim_ins</FitAlgorithm>


      <!-- define method for error estimation -->
      <ErrorMethod>MCMC</ErrorMethod>


      <!-- define number of samplers used for error estimation -->
      <NumberMCMCSampler>20</NumberMCMCSampler>


      <!-- define number of iterations within burn-in phase -->
      <NumberBurnInIter>5</NumberBurnInIter>


      <!-- define sampling method (local or global) -->
      <SampleMethod>global</SampleMethod>


      <!-- define multiplicity of standard deviation (1sigma, 2sigma, 3sigma, etc.) -->
      <MultiplicitySigma>2</MultiplicitySigma>


      <!-- set type of error range (Gaussian, Percentile, HPD, UltraNest) -->
      <ErrorType>hpd</ErrorType>


      <!-- define path and name of backend file -->
      <BackendFileName></BackendFileName>


      <!-- set max. number of iterations -->
      <number_iterations>10</number_iterations>


      <!-- set max. number of processors -->
      <NumberProcessors>6</NumberProcessors>


      <!-- settings for chi^2 -->
      <limit_of_chi2>1e-5</limit_of_chi2>
      <RenormalizedChi2>yes</RenormalizedChi2>
      <DeterminationChi2>default</DeterminationChi2>
      <SaveChi2>yes</SaveChi2>


      <!-- set plot options -->
      <PlotAxisX>Rest Frequency [MHz]</PlotAxisX>
      <PlotAxisY>T_mb [K]</PlotAxisY>
      <PlotIteration>no</PlotIteration>
   </algorithm>
</FitControl>
Call of myXCLASSFit function
Now everything is prepared to start the myXCLASSFit function. Note, we use the scipy optimizer, because the error estimation is much faster compared to the MAGIX implementation.
Start myXCLASSFit function with
>>> from xclass import task_myXCLASSFit
>>> import os

## get path of current directory
>>> LocalPath = os.getcwd() + "/"

# define path and name of molfit file
>>> MolfitsFileName = LocalPath + "files/tutorial-error__molecules.molfit"

# define path and name of obs. xml file
>>> ObsXMLFileName = LocalPath + "files/tutorial-error__obs.xml"

# define path and name of algorithm xml file
>>> AlgorithmXMLFileName = LocalPath + "files/tutorial-error__algorithm.xml"

# set optimization package
>>> Optimizer = "scipy"

# define if results of myXCLASSFit function are return as dictionary
>>> DictOutFlag = True

# call myXCLASSFit function
>>> OutputDictionary = task_myXCLASSFit.myXCLASSFitCore( \
                            MolfitsFileName = MolfitsFileName, \
                            AlgorithmXMLFileName = AlgorithmXMLFileName, \
                            ObsXMLFileName = ObsXMLFileName, \
                            Optimizer = Optimizer, \
                            DictOutFlag = DictOutFlag)
Results
For the model parameters we get the following errors:
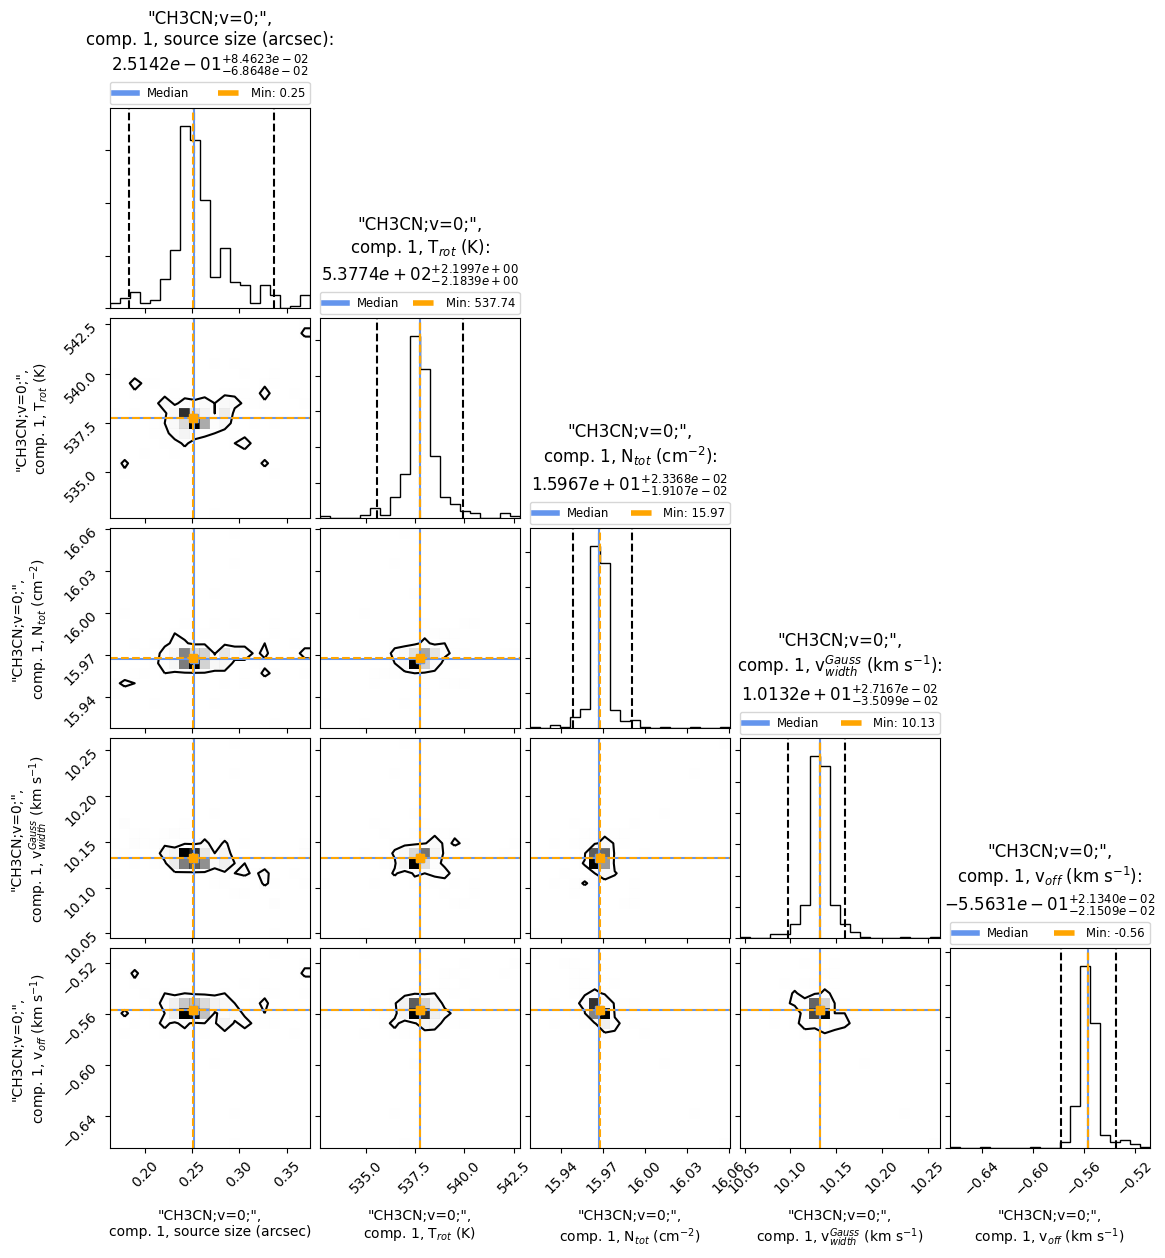
Fig. 17 The corner plot shows all the one and two dimensional projections of the posterior probability distributions of the model parameters. Additionally, it shows the marginalized distribution for each parameter independently in the histograms along the diagonal and then the marginalized two dimensional distributions in the other panels.
Note, among other things, the emcee package uses random numbers, which is why you don’t always get the exact same numbers for each function call.
From the corner plot we can directly see the errors of each model parameter. For example, for the excitation temperature we get \(T_{\rm rot} = 537.74\) K. The lower limit for the error range is \(T_{\rm rot}^{\rm error-low} = 537.74 - 2.1839 = 535.5561\) K and the upper limit is \(T_{\rm rot}^{\rm error-up} = 537.74 + 2.1997 = 539.9397\) K, respectively. Additionally, we see that the probability distribution of the excitation temperature is unimodal, i.e. there is only one best fit for the temperature. Please note, that some parameters, such as the column density, are fitted on log10 scale.